Pssst... want an easy way to stay ahead of weekly consumer trends?
Subscribe to our newsletter
Pssst... want an easy way to stay ahead of weekly consumer trends?
Subscribe to our newsletter


Today marks the release of a new stream of monthly infographics that showcase our latest data and highlight key trends in the global internet landscape.
Our strategy with infographics is to focus on stunning design, producing interesting images that also educate and inform, so we hope you enjoy them.
Our first graphic is a detailed exploration of Twitter usage in 2012, covering 3 key areas:
- Twitter user growth:
- This shows growth in account ownership from 408m accounts in Q2 2012 to 485m accounts in Q4 2012
- More importantly it shows active usage (defined in our research as used or contributed in the past month) as growing from 206m users to 288m, making Twitter the fastest growing social platform in that period
- The curved bars around the active user bubble indicate multi-platform usage, with mobile standing at 57%
- Active user behaviours:
- The bars in the arc around the usage bubble represent behaviours /actions performed in the past month by active users in PC, mobile and tablet
- This provides a unique understanding of how Twitter behaviour segments by device with certain activities being PC dominated (e.g “Uploading / sharing photos”) and others equally distributed by device type (e.g “Buying a product or service (discovery – not direct purchase)”)
- Certain activities particularly appeal to active tablet users (e.g “Asked a friend about a product you were interested in buying” or “Posted a comment about a company or brand”)
- Active user demographics
- We have highlighted the splits by market using Wave 8 (Q4 2012) data. This demonstrates very clearly the global user base that is driving Twitter’s half a billion users, with Saudi Arabia, Indonesia, Turkey, Philippines and Mexico making up the top five markets. This is the reality of the increasingly global landscape for all the leading social platforms
- We have also highlighted key demographics at a global level, demonstrating that people in advertising and marketing or IT are most likely to use Twitter – probably not a surprise. It also shows that the self-employed are most likely to use, which makes sense as our research shows the importance of using social media to build your business. Lastly 25-34 is the leading demographic, the age group increasingly leading adoption and application of social media
[Click on the image to download the PDF]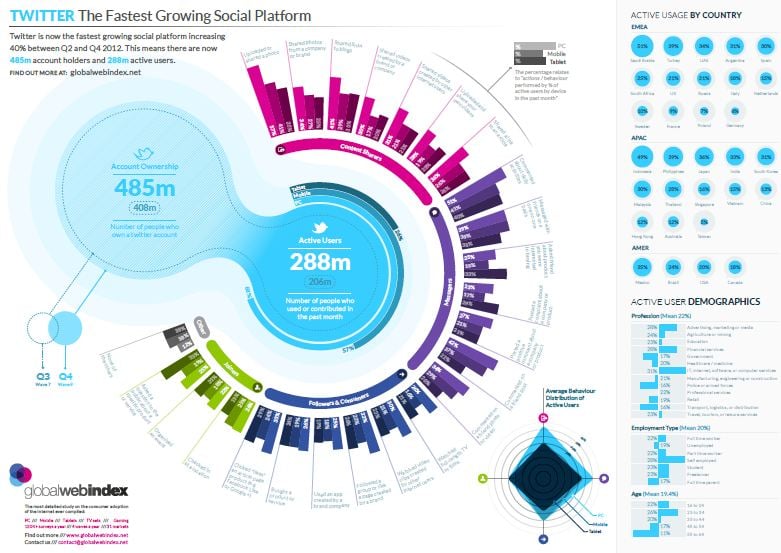
[Click on the image to download the PDF]
Remember, as a client, that these splits are just the tip of the iceberg with over 1,000 demographic variables available to segment the data
We make these infographics free to the community. However, if you are a GlobalWebIndex client we can produce these for you on a custom basis. If you are interested, please speak to your account manager.