Pssst... want an easy way to stay ahead of weekly consumer trends?
Subscribe to our newsletter
Pssst... want an easy way to stay ahead of weekly consumer trends?
Subscribe to our newsletter


Figuring out new markets, understanding new audiences in new countries, and stress testing whether a new product idea has potential to succeed can be a tricky business. And you can’t do any of it without trustworthy consumer research data to back up your next move. So where to start?
Calculating market size is pure gold for brands looking to expand their global reach, take that next leap of growth, or switch up what they’re doing in their current space.
What is market sizing?
Market sizing is exactly what it sounds like: sizing up the potential of a particular market. Looking at the number of people who might buy your product or service, and the total revenue those sales could generate.
How to measure market size
To calculate market size you need data on the number of potential customers, or transactions you could achieve each year. If you’re selling toothbrushes, you can say pretty much everyone in the world needs one. But what if you’re selling a fitness watch? Or a low-alcohol spirit?
This is the part where you need to stop guessing, and start knowing by diving into the data.
First, you need to figure out your target audience – get a picture of who they are, what they like, and where they hang out.
Then, you need to figure out how many potential customers there are in the market you’re looking to target. Using GWI you can create an audience and instantly see how many people it represents in the real world, building reliable numbers into your planning.
Market sizing methods
There are two main approaches to calculating market sizing: top-down (focusing on the supply side) and bottom-up (focusing on the demand side).
Bottom up market sizing
Calculating your market size from the bottom up means looking at realistic demand. You start with your product, your pricing, and the average number of units you can expect customers to buy over a set period of time if you scale slowly. Using those real numbers, you can then figure out what your company can realistically achieve in sales numbers.
Say for example, you wanted to understand the potential market size for launching your chocolate brand in France. Using the bottom-up method, you would need to uncover data on:
- The average cost of chocolates in France
- How many chocolates the average consumer buys a year
This would give you an indication of how much the average chocolate-loving consumer in France spends on chocolates each year.
Next you need to understand how many consumers your brand can expect to reach in France. (This will largely depend on your marketing activation plans and who you’re planning to target). By multiplying these two together you will get your market size.
Bottom-up market sizing is generally more accurate, ideal for new markets, and gives a great financial picture of potential profit.
Top down market sizing
Adopting a top-down approach is a useful way to get a quick overview of the market but the results are largely inaccurate. This method involves looking at the size of the market for your product or service, then using simple arithmetic to see how much that market could be worth to you.
Let’s use the same example. With a top down approach, you would simply multiply the total number of consumers in France who buy chocolate by the likely average size of sale. This would be your total addressable market (TAM), looking at the market as a whole, instead of the portion of the market you’re likely to penetrate.
Clearly that ignores competition for your product and a host of possible objections; not every chocolate fan will want your product, and even those who do won’t necessarily spend the average amount. In short, a top-down approach that focuses on supply will almost certainly lead to wildly optimistic figures.
Top down vs bottom up market sizing
While top-down is quick and simple, it’s also inaccurate, very generic and can lead to false perceptions.
Particularly in cases where you’re looking to enter a new market, or disrupt the status quo with a new product, bottom up is the only way to go.
Top-down gives you an instant snapshot, bottom-up gives you the details for a more commercially robust decision. But what about if you can get the snapshot instantly but also the detail at the same speed? That’s where GWI comes in, instant insights at breadth and depth globally.
—-
Quickfire definitions round:
Defining your market and audience
Figuring out your potential market and forecasting possible future profits is key for any brand, and it takes accurate calculations rooted in data you can rely on.
Total addressable market
The total addressable market (TAM) is the total available market and helps your brand understand how much revenue you could make if you sold to every single customer in the market.
You can calculate this by multiplying the number of customers in a market with the annual value of each customer.
Serviceable available market
The serviceable available market (SAM) is the target addressable market serviced by your brand.
You can calculate this by multiplying the target segment of the TAM with the annual value of each customer.
Serviceable obtainable market
The serviceable obtainable market (SOM) is the percentage of the SAM your brand can actually grab.
You can calculate this by multiplying last year’s market share with this year’s SAM.
Market penetration
Market penetration is how much your brand’s product is actually being used by customers compared to the total potential market.
You can calculate this by dividing the number of customers you have by the target market size.
——
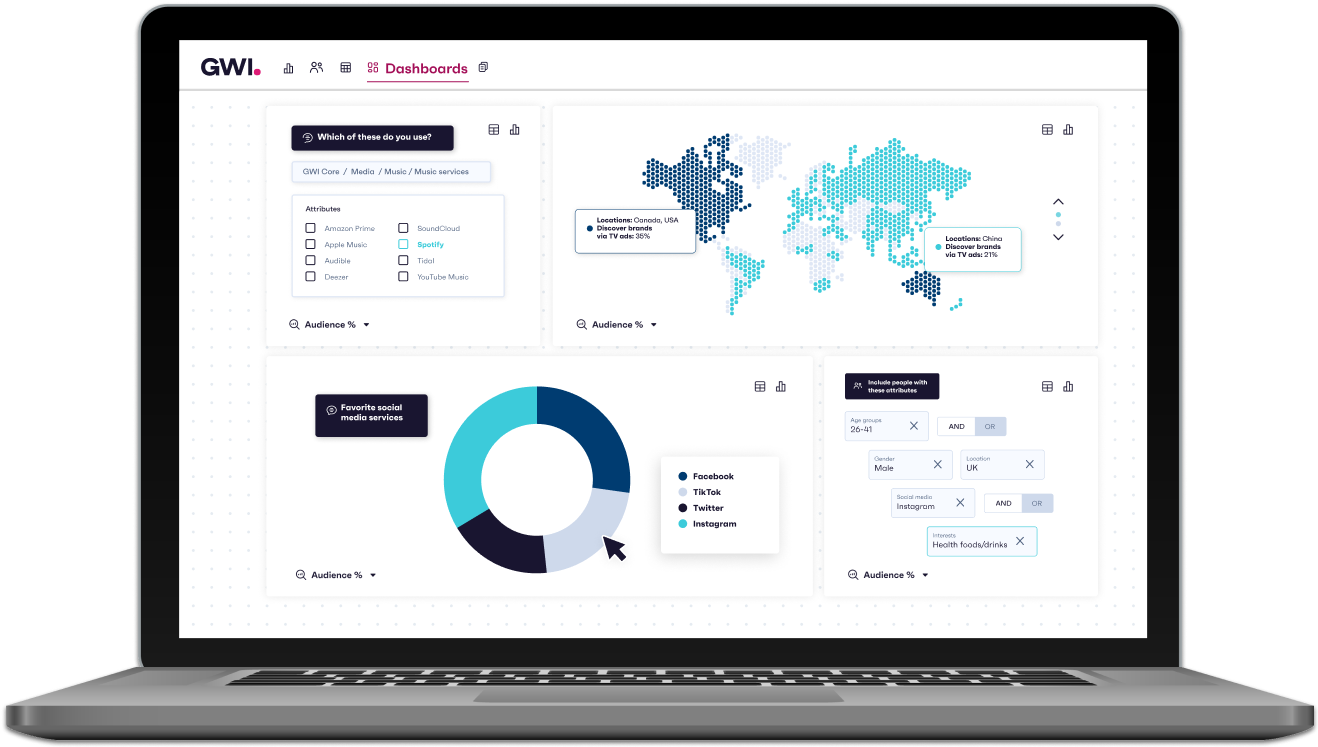
Why you should calculate market size with GWI
When it comes to calculating market size and making big business decisions on new markets and products, you need data you trust. We run the world’s largest study on the online consumer. Brands like Spotify, Microsoft, LinkedIn, Snapchat, and a whole heap of others rely on GWI, so when it comes to market sizing, you’re in good hands.
- Market size is a moving target. Spotting early consumer trends to plug into forecast models is something that consumer insights HAS to be part of, and it’s something we’re kind of pros at.
- With market sizing, it’s really important to have historic and trending data. Being able to zoom out and see changes, but also zero in on fluctuations by quarter is vital for brands big and small.
- Topline market size is one thing – but GWI can actually help you define how much money you can make in the market with data on purchase intent, willingness to pay, and spending behaviors. Consumer Insights can be overlaid with your own data (EPOS, Sales, Shipment numbers etc) to help predict market direction and future growth.
- GWI’s segmentation functionality is a gamechanger for your brand. By using either Core or Custom to create your segments, you can size up your target audiences by market for each segment on a global scale.
- You can also create new (or recreate existing) segmentations, and use these specific audiences to plug into your advertising to ensure you’re reaching the right people
- If you need to get granular or want to dig deeper in a specific area, you can recontact specific audiences in the platform and ask additional questions, or further segment through custom.
How to calculate market size and identify expansion opportunities with GWI
A step by step guide to understanding audience and market size
Say you’re a whiskey brand looking to check what market is the best bet for your brand to expand into. Here’s how simple it can be with GWI.
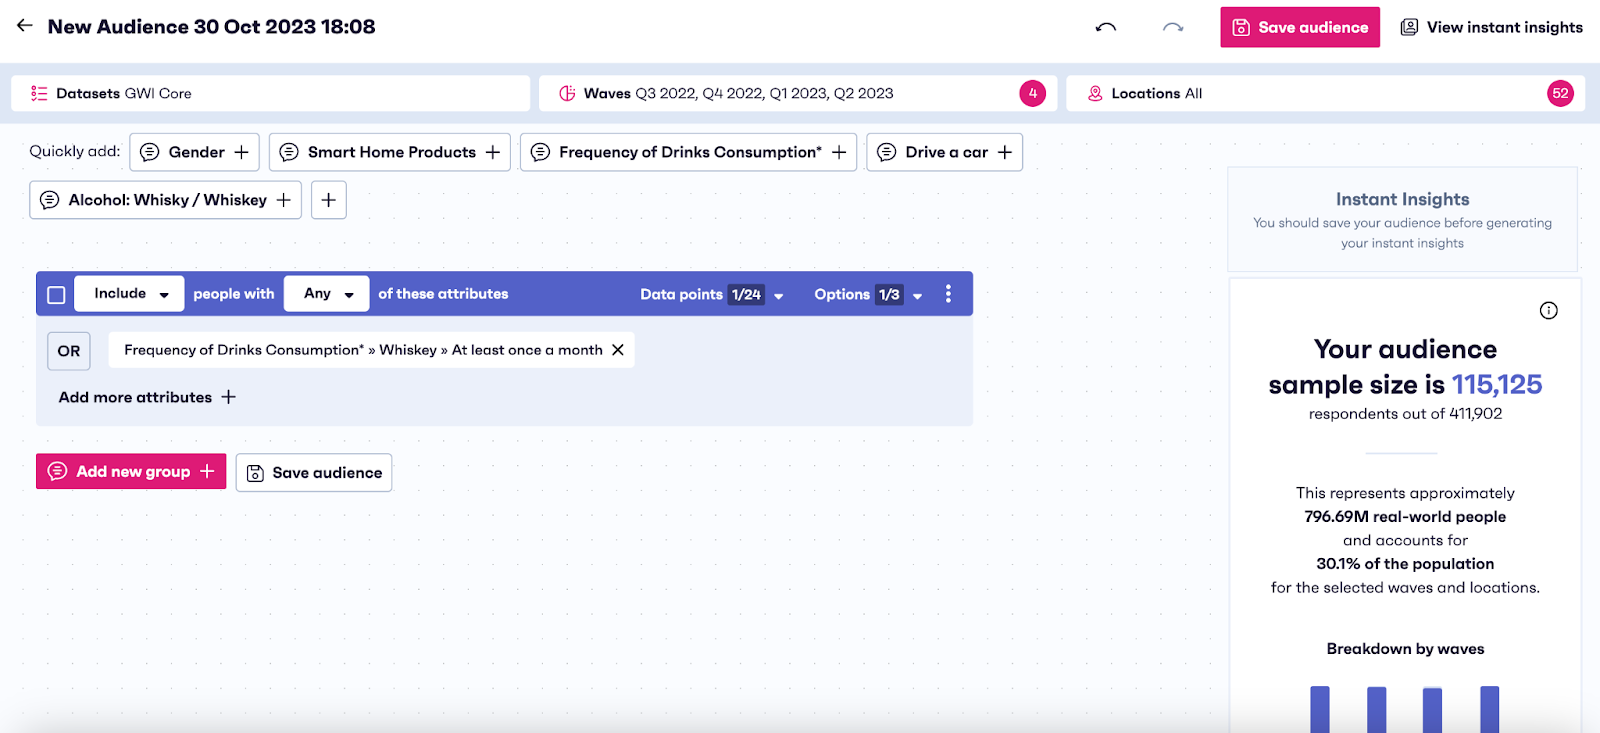
- Create an audience.
The first step is building your audience. Here you should really be looking at product purchasers, those who’ve either recently or are planning to purchase a product, or those who engage with a behavior regularly – for example those who drink alcohol.
When you define your audience, you can open the audience size question and apply the audience here. This will give you the total audience size globally, which is 115,125 million whiskey drinkers (correct as of November 2023).
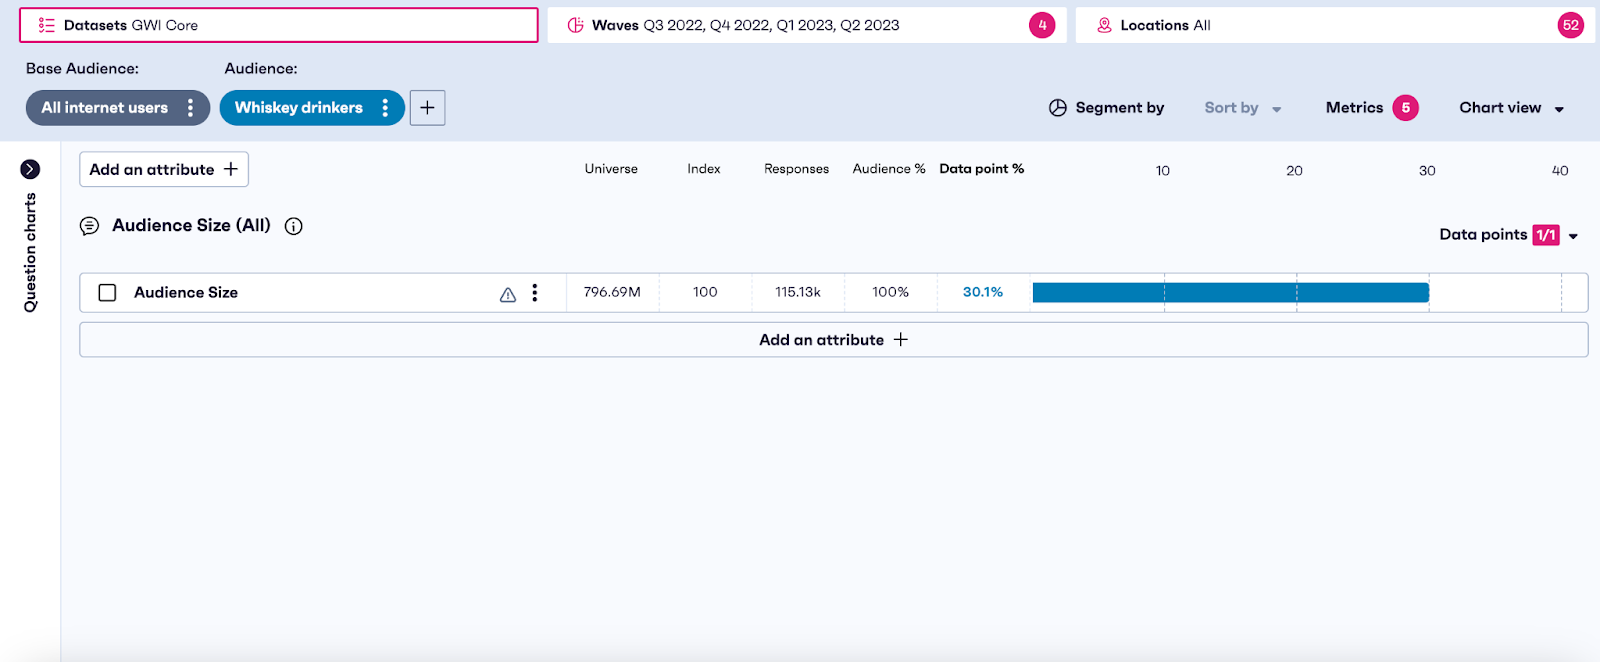
2. Begin building your chart
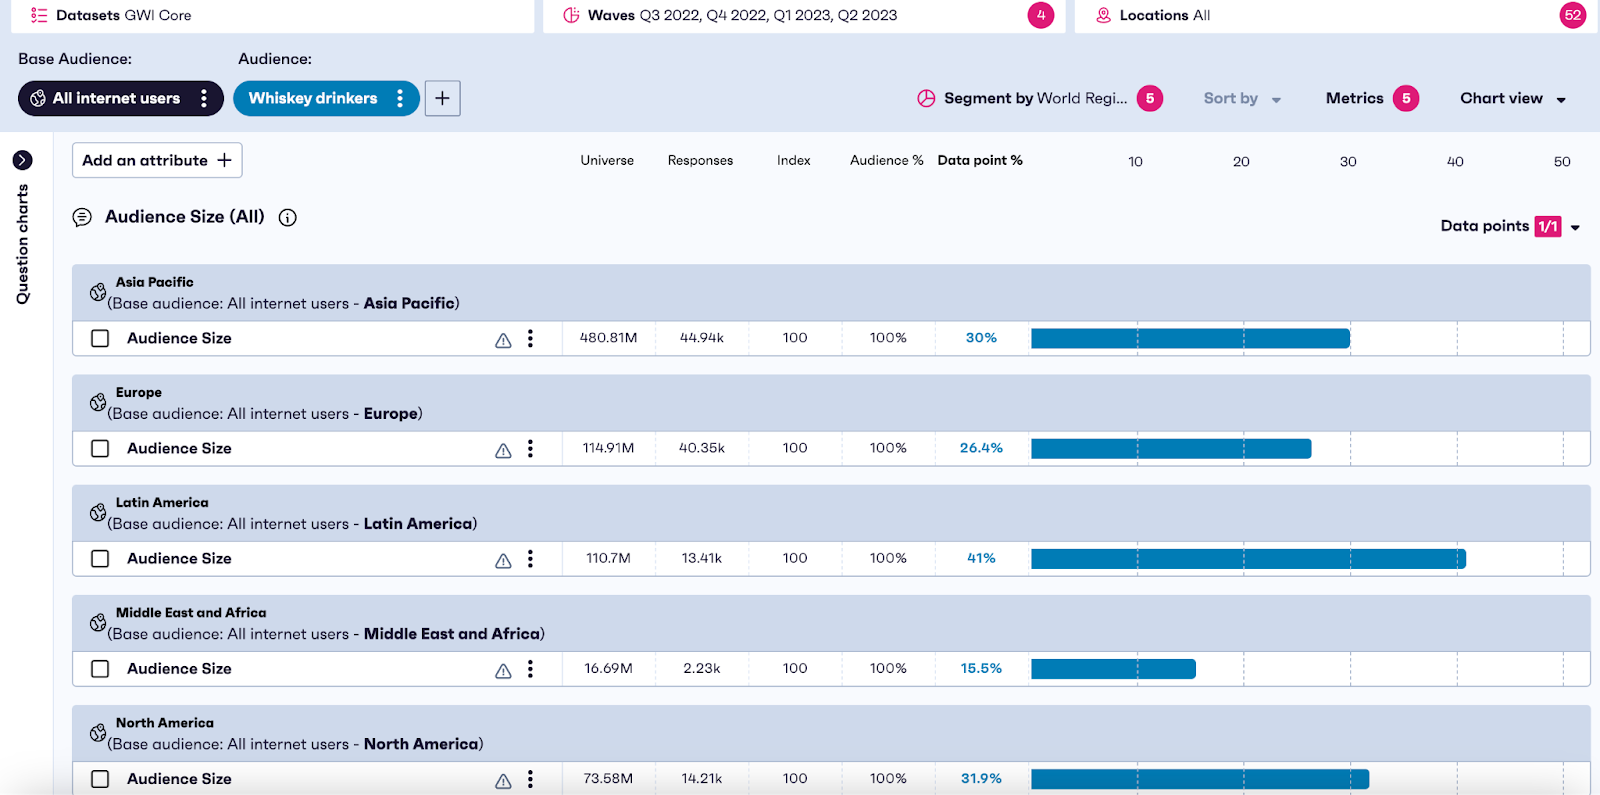
So now you want to see which country has the highest percentage of whiskey drinkers. Head to charts, apply your saved audience of whiskey drinkers, go to “add attribute” and select “audience size”.
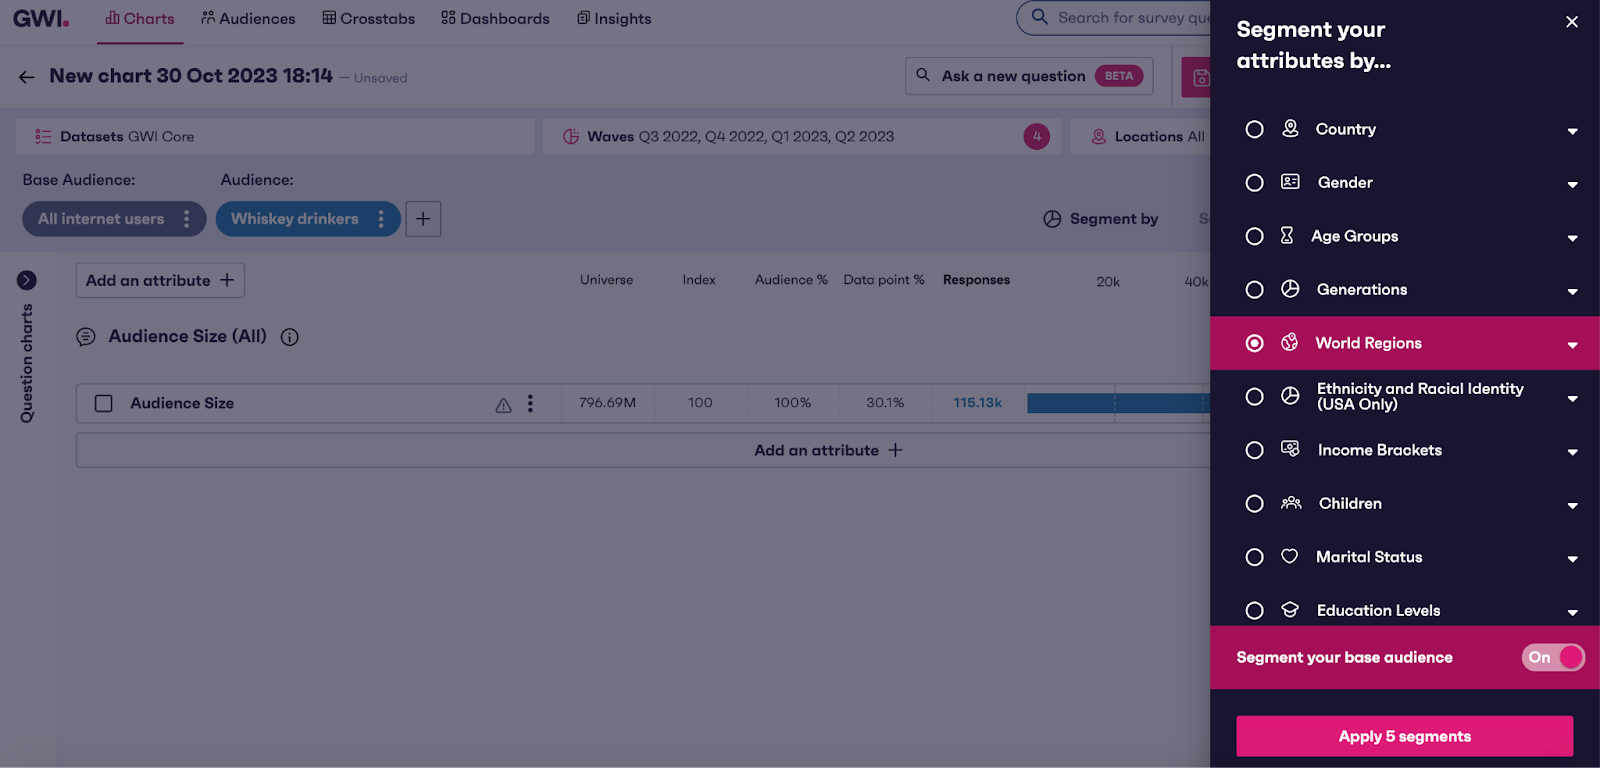
Then go to “Segment by” and select “By world region”. Make sure you click “On” where it asks you whether you want to segment your base audience.
3. Refine by region
Here you can select segment your base audience and look at the data point percentage to see which country has the highest amount of whiskey drinkers – here we can see that it’s Latin America with 41%.
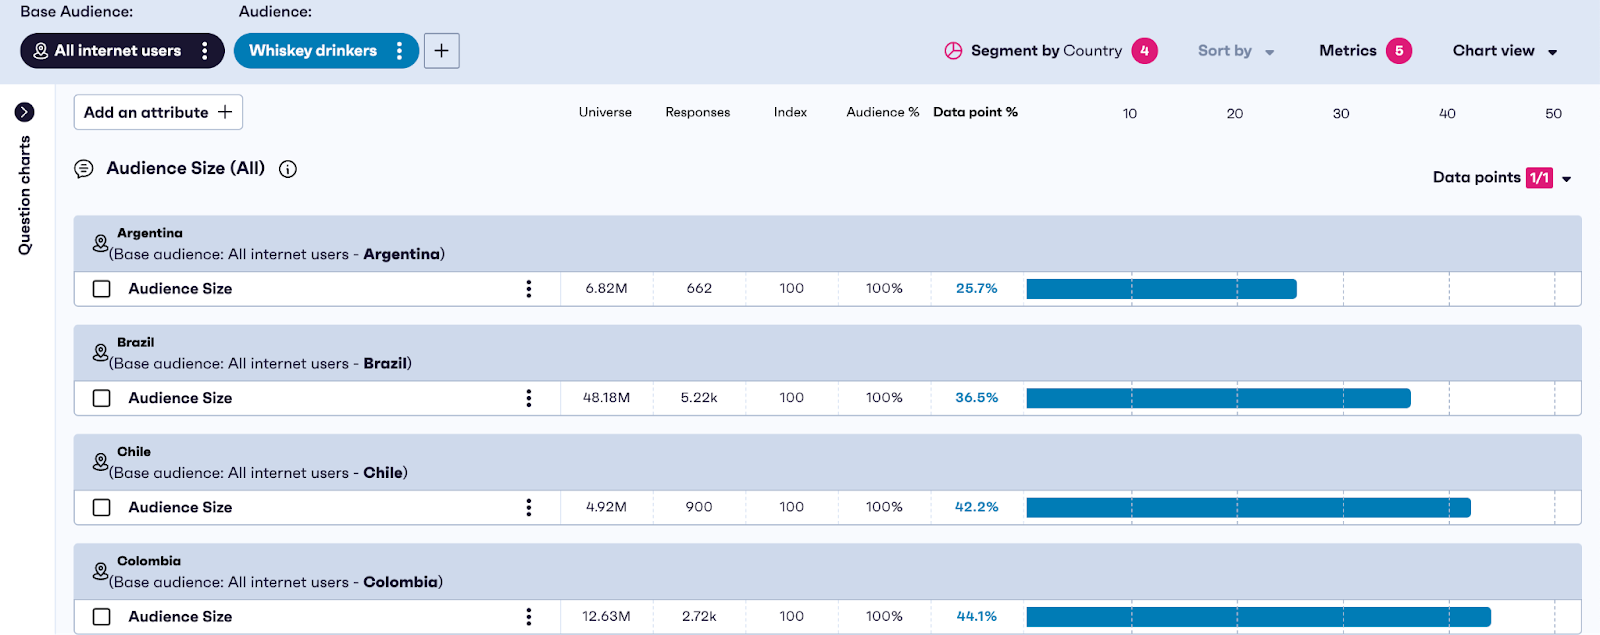
4. Drill down by country
Latin America is a pretty broad region, so it’s time to get specific. Here, you need to remove the global region segment and change the location to Latin America. Now segment by country.
Now we can see the percentage of whiskey drinkers in each country – and, just like that, the best market to expand into with your whiskey brand.
5. Dive into your new audience
Now you’ve got your audience, you can begin to dig deeper into their consumption habits, brand engagement and attitudes, and marketing touchpoints to start building out your strategy.
Utilizing global trending data to predict market direction and purchase intention
Let’s say you’re a successful wellbeing company with a range of gut health products. You’ve got a line of digestive health supplements that are doing incredibly well in the UK, but you’re ready for transatlantic growth. You’ve seen a number of US influencers promote health supplements, but you want some hardcore data to back up your launch.
When taking a look at this data, we can see that the percentage of Americans who say they take health supplements has gone from 12% in Q2 2020, to 16% in Q2 2023. That’s a pretty good case for your brand.

30% increase (from Q2 2020 to Q2 2023)
In fact, the gut health market seems so strong, you’re considering trialing a line of kombucha in the US. So you dig into the data.

If you were to compare the Q4 2022 to Q1 2023, you might think there’s a growing trend at play. But when you zoom out and see historical trending data, you can tell it might not be the right time. In fact, those drinking kombucha have been fluctuating since Q2 2020, but you wouldn’t have discovered the volatility without viewing interest on a historical timeline.
GWI in action: How Blizzard Entertainment drove growth across regions
Blizzard Entertainment is a leading entertainment software developer and one of the most popular and well-respected makers of computer games.
Commercialization is at the very top of their agenda, based largely on creating effective partnerships. To drive this, the brand needs to craft compelling, data-rich narratives that show how Blizzard and its esports audience are worthy of investment.
When an opportunity arose with a leading U.S.-based snack brand, Blizzard’s sales team needed to prove their esports audience had an interest in buying the snack.
To do that they needed a story that stood out and was supported by hard data. The difficulty was their existing understanding was missing the vital global view.
Blizzard set to work leveraging GWI data to show how esports fans across key markets really felt about the snack brand in question.
As Alan Lan, Strategy & Analytics Manager for AB Esports at Blizzard, puts it, “The data on purchase intent and consideration was especially valuable. It proved we weren’t making assumptions and that our recommendations were based on fact.”
Using GWI data, Blizzard were able to say exactly how many of their esport audience used the snack in each category, along with how this compared to their competitors and the overall market size.
The result showed the true market potential of the partnership, offering quantifiable proof to justify long-term investment.
As a result the snack brand signed a sponsorship deal for Blizzard’s prominent Overwatch League, followed by a multi-year partnership that opens the door to even more future growth.
The case for market sizing
Market sizing helps new and expanding businesses to:
- Get a broad understanding of their audience and market trends based on up-to-the-minute data
- Assess the demand for a product or service, both in general and in light of new trends events
- Understand audiences in detail, so brands know exactly who to target, which channels to use, and who to ignore
- Use a data source that provides instant, authoritative answers on audience numbers, both globally and in specific markets
Market Sizing FAQs
1. What does market size mean?
Market size is the total number of potential customers in a market.
2. What is the difference between market size and market share?
Market share is how much of the market is held by a single brand, it’s different to market size as it’s based on the actual figures rather than potential ones.
3. How do you find your total addressable market?
You can find your total addressable market by multiplying the number of customers in your potential market with the annual value of each customer.